Gain and Sustain: The Affordable Connectivity Program is Getting More People Online

Wednesday, November 1, 2023
Digital Beat
Gain and Sustain:
The Affordable Connectivity Program is Getting More People Online

Data analysis shows positive relationship between broadband adoption growth and levels of ACP enrollment
There is a positive and significant correlation between broadband adoption growth and Affordable Connectivity Program (ACP) enrollment. As of December 2022, ACP was aiding one in every eight residential broadband connections in metro and urban counties in the United States, many of them new subscribers.
New analysis of the 2022 American Community Survey (ACS) and ACP enrollment data points to important findings as Members of Congress consider additional funding for ACP.
- First, places that have experienced strong broadband adoption growth in recent years generally have higher-than-expected rates of ACP enrollment, pointing to the likelihood that ACP has had an impact on that growth.
- Second, places where ACP enrollment growth was strong throughout the 2022 calendar year tend to have above-average broadband subscription levels in 2022 data.
These findings come from analysis of ACS 2022 data at the county level and 2022 ACP enrollment data, also at the county level. The ability to match government-collected broadband adoption data with ACP enrollment in the same geographies offers a unique opportunity to draw early lessons on ACP’s effectiveness. For the counties included in this analysis, subscriptions to broadband of any type grew by 3.5 percentage points from 2019-2021 and a more modest 0.7 points from 2021-22. By the end of 2022, 12.5 million households were enrolled in ACP in the counties analyzed in this report, or 1 out of 8 broadband subscriptions of any sort.
The statistical relationships between broadband adoption and ACP enrollment are significant, and they explain only a portion of what is going on with broadband adoption nationally. But the fact that ACP enrollment has a statistical impact on levels of and changes in broadband adoption is an important finding in itself.
These findings paint a nuanced portrait of ACP’s role in broadband adoption. Given that, from 2019 to 2021, broadband adoption growth was greatest in high-poverty cities, the link between adoption increases in that period and ACP enrollment in 2022 indicates that the subsidy program has helped lock in those gains. And while the “broadband pie” grew slowly from 2021 to 2022, the data show that ACP enrollment played a supporting role in that growth.
Background
A question looming over the Affordable Connectivity Plan (ACP) is its impact on the digital divide. There are those who argue that its primary objective should be to connect people who haven’t previously been broadband subscribers. Yet the program’s focus on affordability means it has twin goals. One is to get those disconnected online. The other is to maintain connectivity for online households who struggle to pay their monthly bill.
Recently released American Community Survey (ACS) data offers an opportunity to examine how the ACP is impacting broadband adoption in U.S. counties. ACS 2022 data provides a 1-year estimate on broadband adoption at different levels of geography—counties included. The Universal Service Administrative Company (USAC), which administers ACP, reports ACP enrollment by county on a monthly basis. This provides an apples-to-apples means by which to examine broadband adoption and ACP enrollment at the same level of geography. This, in turn, invites two related questions which county-level analysis can help address:
- What is the relationship between the growth in broadband adoption in recent years and levels of ACP enrollment?
- Does growth in ACP enrollment in the 2022 calendar year have a relationship to broadband adoption levels as recorded by ACS in 2022?
The Data
Before getting to the analysis, a few points on the data. ACS 1-year data provides estimates only for those counties with enough population to draw a sufficient sample size. That is a total of 810 counties in this analysis, which is far short of the total number of counties in the United States (3,143). However, these 810 counties account for about 108 million households, or about 84% of all U.S. households. This analysis therefore centers on urban and metropolitan areas of the country, not rural places.[1]
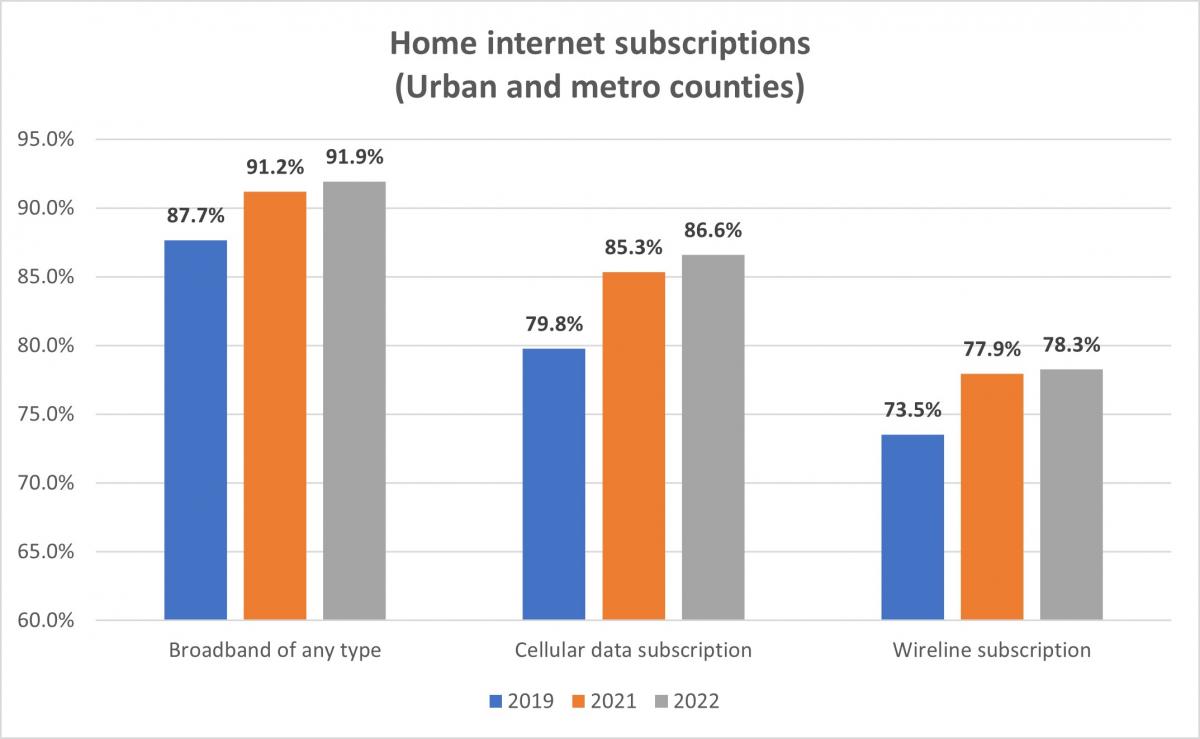
In aggregate, broadband adoption grew strongly from 2019 to 2021, but only modestly from 2021 to 2022. The table below shows subscription growth for the 810 counties used in this analysis for households with any type of broadband subscription—those with wireline subscriptions and those with a cellular data subscription. The share of households dependent only on cellular data for home internet subscriptions changed little over this period, starting at 11.1% in 2019, declining to 10.2% in 2021 before ticking up to 10.6% in 2022.
The reasons for the growth between 2019 and 2021 are not entirely clear. Some of it is likely due to public-spirited efforts to address the digital divide when the pandemic sent everyone home including:
- expanded discounts from carriers,
- pledges to not disconnect late-payers in the pandemic’s early days, and
- ACP’s predecessor, the Emergency Broadband Benefit, launched in May 2021.
The decades-long migration of so many societal functions to the internet—such as interacting with government, healthcare providers, and keeping up with news and culture—may have also spurred adoption increases irrespective of the pandemic. The 2019 to 2021 growth in broadband was generally strongest in high-poverty cities.
For the counties examined in the analysis, USAC reports that some 12.5 million households had enrolled in ACP by the end of December 2022, while the ACS shows that 99.8 million households in the 810 counties had a broadband subscription of any type in 2022. In other words, 1 in 8 (12.5%) broadband subscribers in these counties were using ACP as part of their service by the end of 2022. At the end of 2021, about 8% of broadband subscribers used ACP (at an enrollment level of 7.8 million households in the 810 counties). Because ACP permits eligible consumers to use the benefit for wireline or wireless service, the analysis that follows will mainly use the ACS variable called “broadband of any type.” That variable is most closely comparable to what ACP enrollment data captures.
I. The relationship between broadband adoption growth and levels of ACP enrollment
To start, we examine the level of ACP enrollment (as a share of all ACP-eligible households) at the end of 2022 and the change in the share of households in a county that subscribed to broadband of any type from 2021 to 2022. This analysis takes advantage of the fact that, although overall broadband subscriptions only rose from 91.2% to 91.9% in the 2021 to 2022 period, there is variation in that growth figure across the 810 counties. If the expectation is that ACP has a positive association with overall broadband subscriptions, then there should be a positive correlation between counties’ broadband adoption rates and their rates of ACP enrollment. As it happens, statistical analysis shows that there is a positive and significant correlation between growth in broadband-of-any-type subscriptions between 2021 and 2022 and levels of ACP enrollment.[2]
A similar analysis is possible for change in broadband-of-any-type subscriptions between 2019 and 2021 and ACP enrollment (as a share of eligible households) at the start of 2022 (in January). As noted above, overall growth in broadband-of-any-type was much stronger in that two-year period (3.5 percentage points) than the one-year 2021-2022 growth of 0.7 points. The correlation between subscription growth and level of ACP enrollment is positive and somewhat than the 2021-22 analysis.[3] The finding of a positive relationship in county data between ACP enrollment and subscriptions to “broadband of any type” is consistent with analysis of 5-digit zip code areas that also showed a relationship between broadband uptake and places with strong ACP enrollment.
What about wireline broadband and cellular data subscriptions? For the 2019 to 2021 timeframe, there is a positive correlation between wireline adoption growth and ACP enrollment in January 2022. For cellular data subscription, the numbers are the same, with a positive correlation between counties with strong cellular data subscription growth from 2019-21 and ACP enrollments levels in January 2022.[4] For the 2021 to 2022 period, there was very little change in wireline adoption for the 810 counties between 2021 and 2022 (just 0.4 of a point tick upward) and no correlation between growth and ACP enrollment as of January 2022. There was also no correlation for the 2021-22 period for cellular data subscriptions and ACP enrollment levels in January 2022.
II. Growth in ACP enrollment in counties in 2022 and adoption levels in 2022
If the data suggests that at least some portion of changes in broadband adoption in recent years is attributable to ACP enrollment, it is worth looking at relationships between growth in ACP enrollment and levels of subscription to different broadband services. As noted earlier, ACP enrollment grew from 7.8 million households to 12.5 million households from January 2022 to December 2022 for the 810 counties in the analysis. Some counties experienced greater growth in ACP enrollment (as a share of eligible households in the county) than others. Is there a correlation between ACP enrollment growth in counties and broadband subscription levels for 2022? The answer is yes—there is a positive correlation of both wireline and broadband-of-any-type. For cellular data subscriptions, there is also a positive correlation.[5]
There is a notable negative correlation between “cell only” subscriptions and growth in ACP.[6] Households that rely only on cellular data subscriptions generally have lower incomes than those able to afford multiple subscriptions (i.e., wireline and wireless service). For this dataset on counties, poverty levels rise with the share of households relying only on cellular data for internet service.[7] Yet counties experiencing strong ACP enrollment are ones with lower shares of households relying on cellular subscriptions only for service. This indicates that, to some degree, ACP is helping some households acquire an additional connection option—and that is most likely a wireline subscription.
What Does It All Mean?
This analysis suggests that the ACP is contributing to an expansion of the “broadband subscription pie” that got underway in the United States sometime during the pandemic. The advent of the ACP in 2022 helped sustain those gains and, as this analysis suggest, contributed to incremental gains in broadband subscription from 2021 to 2022.
It is also clear that ACP’s impact does not fall neatly into one box. The 2019 to 2022 period (for the urban and metro counties in this analysis) exhibited strong growth in wireline and cellular broadband, especially in the first two years. Positive relationships for both wireline and wireless adoption and ACP enrollment indicate that some consumers used ACP for wireline service plans and some for wireless. The strong correlations for broadband-of-any-type (i.e., either wireline or wireless) service does indicate that ACP has a connection to higher adoption rates. The negative correlation between “cell only” and growth in ACP enrollment is important to this finding. It points to fewer households having only one option for service and ACP playing a role in this.
The overall implication of this analysis is one of “gain and sustain”: ACP has helped sustain the increase in broadband adoption that happened during the pandemic and that seems to be the greater part of the program’s overall impact. ACP has also, even if to a more modest degree, aided in gains in overall broadband adoption since the program was launched in 2022.
John B. Horrigan is a Benton Senior Fellow and a national expert on technology adoption, digital inclusion, and evaluating the outcomes and impacts of programs designed to promote communications technology adoption and use.
Notes:
[1] The ACS data used here are 1-year estimates for 2019, 2021, and 2022; data for 2020 is not available because the pandemic made it impossible for the Census Bureau to develop reliable 1-year estimates from the ACS.
[2] The statistical analysis shows a positive correlation of 0.17 between percentage growth in broadband of any type between 2021 and 2022 and level of ACP enrollment as a share of eligible households in January 2022. The correlation is larger (0.52) for 2021 and 2022 difference in total number of broadband subscribers and the total number of ACP enrollees in January 2022.
[3] The correlation coefficient in this case is 0.25 and the correlation is 0.84 for changes in number of broadband subscriptions between 2019 and 2021 and ACP enrollment levels in January 2022.
[4] The correlation coefficient for wireline growth is 0.27 and for cellular data growth it is 0.22.
[5] The correlations for changes in ACP enrollment in the 2022 calendar year for broadband of any type and wireline subscription levels for 2022 was 0.25 for both. For cellular data subscriptions, the correlation was 0.21.
[6] The correlation for growth in ACP enrollment and the share of “cell only” households was -0.21.
[7] The correlation between “cell only” households and 2022 poverty levels was 0.38 for the 810 counties.
The Benton Institute for Broadband & Society is a non-profit organization dedicated to ensuring that all people in the U.S. have access to competitive, High-Performance Broadband regardless of where they live or who they are. We believe communication policy - rooted in the values of access, equity, and diversity - has the power to deliver new opportunities and strengthen communities.
© Benton Institute for Broadband & Society 2023. Redistribution of this email publication - both internally and externally - is encouraged if it includes this copyright statement.
For subscribe/unsubscribe info, please email headlinesATbentonDOTorg

Kevin Taglang
Executive Editor, Communications-related Headlines
Benton Institute
for Broadband & Society
1041 Ridge Rd, Unit 214
Wilmette, IL 60091
847-220-4531
headlines AT benton DOT org
Share this edition:


Broadband Delivers Opportunities and Strengthens Communities