How Surveys, Speed Tests, and Spatial Analysis Help Us Understand the Digital Divide

Tuesday, September 26, 2023
Digital Beat
How Surveys, Speed Tests, and Spatial Analysis Help Us Understand the Digital Divide
Each year, TPRC and the Benton Institute for Broadband & Society recognize scholarship in the area of digital inclusion and broadband adoption with the Charles Benton Broadband & Society Prize. For 2023, Merit Network's Amy Stuyvesant and Julia Piscioniere are runners-up for their paper Michigan Broadband Personas—Assessing Why Households Lack Reliable Service Using Survey Responses, Speed Tests, and Location.
An Exploratory Approach

The digital divide is multi-faceted and currently there is no single set of instructions for how it can be closed. Broadly speaking, there are at least two main reasons why a location may not have high-speed internet: 1) Infrastructure deficiencies, meaning either the complete absence of infrastructure, or the present infrastructure is insufficient for delivering broadband speeds and 2) the proper infrastructure is present, but there is a lack of adoption from the people who could theoretically take advantage of it. Within each of these buckets is a tangled world of nuance, and this study examined how a combination of granular geospatial analysis, speed measurements, and survey responses can help organize and think through these intertwined relationships.
This study leverages household-level data collected via a survey and speed test combination. Multiple study areas, with a typical area consisting of a single county, went through a data collection effort with a handful of study areas selected for deeper analysis. Results should be thought of as part of a proof of concept demonstrating the value of collecting granular data on both internet speed and public sentiment. This exploration also begins to peel back the layers of how advanced geospatial analyses can identify patterns and inspire solutions. While the full research paper details this analysis, the main takeaways have been summarized here.
Geographically Contextualizing Speed Data
Creating a method to analyze speed measurements and infrastructure audit data leads to more robust unpacking of the ultimate causes of low speeds. This idea of intentionally measuring connectivity can again be split into two major buckets: 1) browser-based measurements and 2) non-browser-based measurements, such as a hardware-based approach. While the first may be more widely available, there are many biases to consider. For example, the speed test taker's rationale for conducting a measurement (disgruntled perhaps, or excited about their new fiber connection), the time of day, whether they are wired in for the test, distance from their router, their specific machine, and more (Baur et. al, 2010).
Although this study utilized browser-based speed measurements, the combination of a citizen-science campaign with targeted marketing and mailers, an option for respondents to indicate where they have no service, and geospatial cluster and outlier analysis allows for an opportunity to better leverage browser-based speed measurements when hardware-based measurements may not be feasible. Just as contextualizing speed test data to subscription tier is important for analysis (Paul et. al, 2022), including location as a factor aids in this regard as well.
The figure below on the left displays everywhere a survey response indicated that their household does not have service or their speed measurement came in below 25/3 Mbps. On the right, the same data is displayed, but it has undergone a cluster/outlier technique.
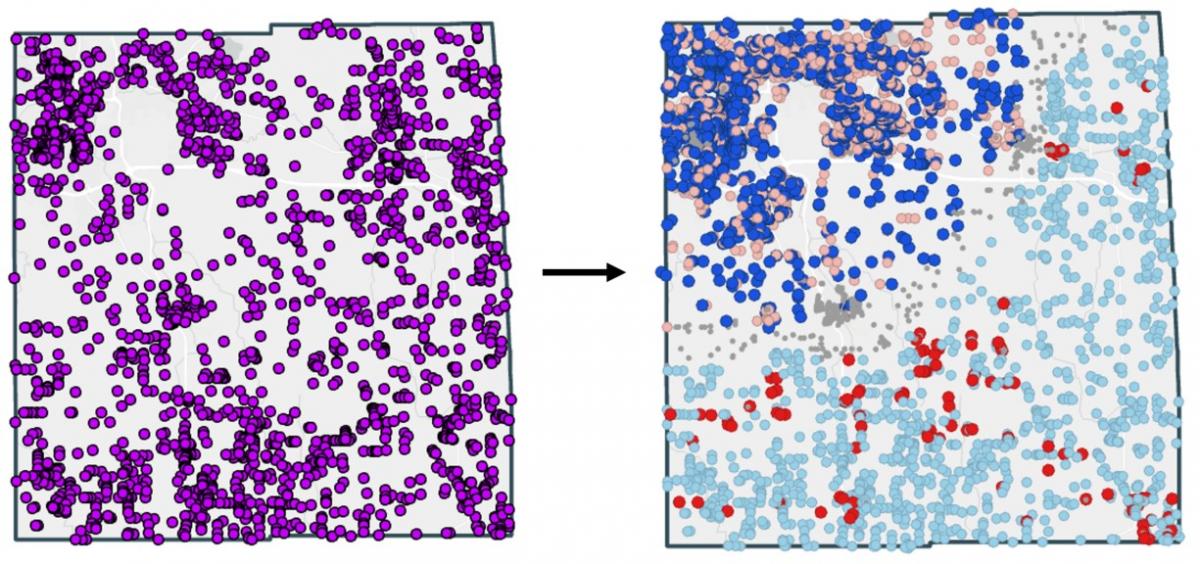
While the map on the left demonstrates that there are unserved households throughout the whole study area, the map on the right has distinct zones, making it more apparent which speeds are low due to a lack of infrastructure and which are low despite sufficient infrastructure presence. Light blue points on the map indicate low speeds surrounded by other low speeds, likely identifying areas where infrastructure is lacking. The dark blue points indicate low speeds surrounded by a cluster of higher speeds (seen in light red), indicating higher speeds are theoretically available, but this is not reflected in the actual speed measurement. Unpacking this dark blue population is key to an equitable internet, regardless of whether the low speeds are a result of browser or hardware underperformance or social-based limitations.
A Dynamic Population
Speed measurements are only one component to the digital divide. Where infrastructure is present and the lack of a connection is explained by equity and adoption rates, many complex interconnections exist. The survey questions address how various proximate causes are related, such as canceling or cutting back service and searching for other provider options.
This study classified respondents as being in a dynamic population if they indicated they are currently served and have canceled or scaled back service in the past 12 months OR if they are currently unserved and have had access in the past 12 months. Through regression analysis, some of the key takeaways on this population are as follows:
- The geographic reach of the dynamic population is spread out across the study area rather than existing in distinct siloes.
- Significant predictor variables are not consistent across study areas, but some of the variables are more consistent than others:
- Higher rates of competition and being location in a more urban area are more likely to result in a respondent being dynamic and currently unserved.
- Respondents who indicated they are willing to pay a monthly fee below average are more likely to be dynamic and currently unserved.
- Respondents that would not subscribe at any price are less likely to be dynamic and more likely to be currently unserved.
Land Use as an Alternative to an Urban/Rural Ratio
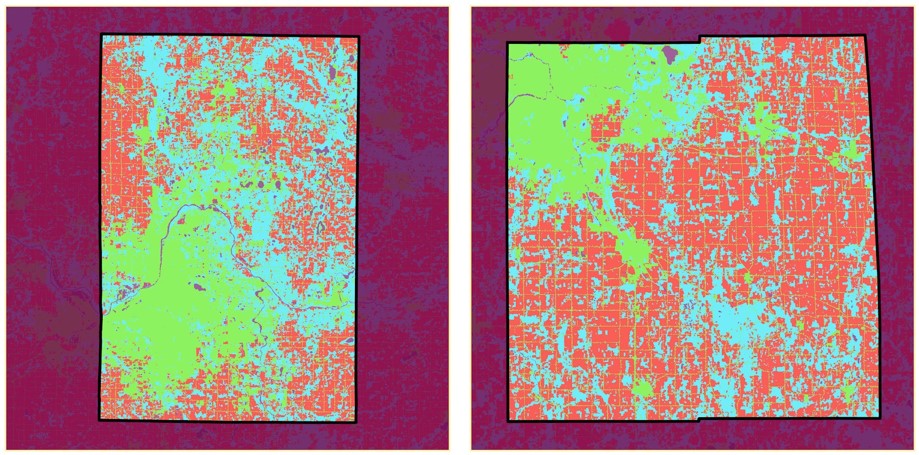
Using the National Land Cover Database (NLCD) raster for a land cover variable allows for more granular comparisons to urban/rural ratios and also more flexibility in analysis breakdown groups, like agriculture or forested areas within a rural area. Here is an example of two study areas with re-classified NLCD rasters:
We can then look at how speed measurements compare across land cover types. Here is an example comparison with download speeds across four study areas, with the fifth comparison (seen on the far right) including all study areas in one (note that like letters indicate no significant difference and differing letters indicate there is a significant difference):
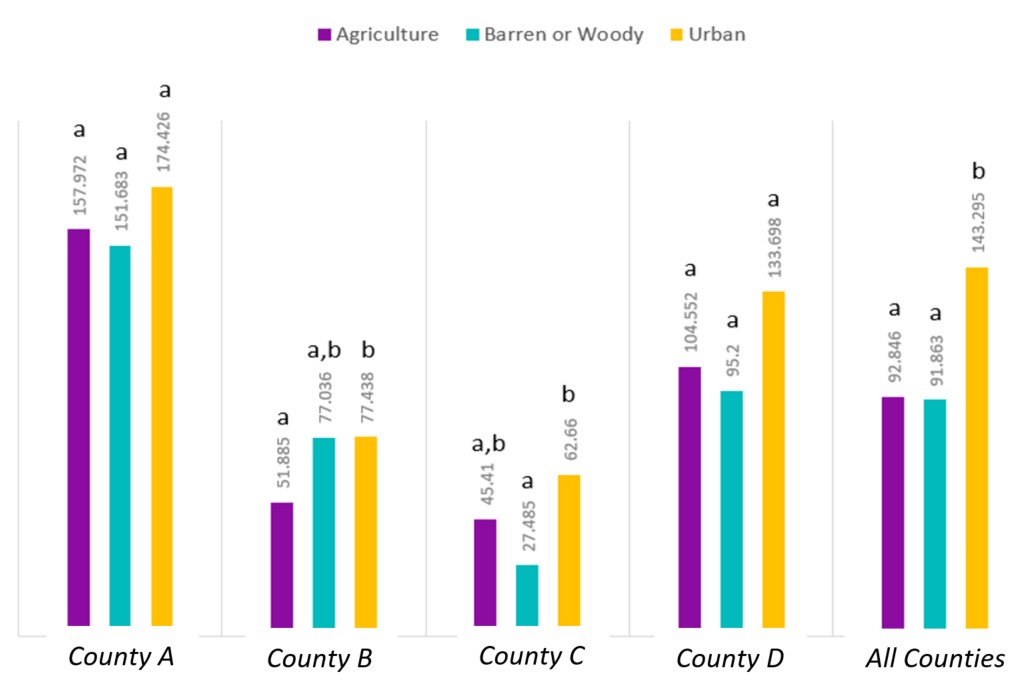
We see that generally the urban average download speeds are significantly higher and the agricultural and barren or woody natural speeds differ in how they relate to each other as well as how they relate to the urban average speeds. It is also worth noting that the section where all study areas are combined into one, representing more of a macro or statewide analysis, smooths out the granular differences we see across study areas. Further regression analysis also showed that the urban areas were more likely to have a higher number of ISPs present, contain respondents in the dynamic population, and contain those low speeds surrounded by higher speeds (the dark blue points on the map above).
Summary and Conclusion
From this exploratory analysis, we learned that the combination of a targeted marketing campaign during data collection plus the cluster/outlier analysis provided a useful spatial contextualization to the data, illuminating new patterns that matched very closely to on-the-ground infrastructure audits. We also learned that the NLCD rasters provide an alternative option for a more granular metric on the classic urban/rural ratios. Additionally, the deeper regression analysis that weaved in survey response data demonstrated the value that would be added in including socioeconomic and/or demographic survey questions. Our mapping and analysis further demonstrated that while there may be macro-views of distinct geographic pockets experiencing various broadband issues, those households existing in that dynamic population in-and-out of service over the year spread out throughout the entire study area and would benefit from more granular analysis when possible.
The goal of this paper was to explore analytical techniques that combine geospatial analysis, survey responses, and speed measurements as a proof of concept for using available granular datasets and new techniques. These results aim to provide additional tools the larger research community can consider as we build a better understanding of the equity component of broadband access.
References
Bauer, S., Clark, David D., Lehr, W., Understanding Broadband Speed Measurements (August 15, 2010). TPRC 2010, Available at SSRN: https://ssrn.com/abstract=1988332
Paul, U., Liu, J., Gu, M., Gupta, A., and Belding, E., The importance of contextualization of crowdsourced active speed test measurements (October 25, 2022). IMC '22: Proceedings of the 22nd ACM Internet Measurement Conference, Available at: https://doi.org/10.1145/3517745.3561441
Paul, U., Gunasekaran, V., Liu, J., Narchania, T. N. and Belding, E., Decoding the Divide: Analyzing Disparities in Broadband Plans Offered by Major US ISPs (February 28, 2023). arXiv preprint arXiv:2302.14216, Available at: https://arxiv.org/abs/2302.
Amy Stuyvesant, GISP, is a Senior GIS and Data Analyst at Merit Network.
The Benton Institute for Broadband & Society is a non-profit organization dedicated to ensuring that all people in the U.S. have access to competitive, High-Performance Broadband regardless of where they live or who they are. We believe communication policy - rooted in the values of access, equity, and diversity - has the power to deliver new opportunities and strengthen communities.
© Benton Institute for Broadband & Society 2023. Redistribution of this email publication - both internally and externally - is encouraged if it includes this copyright statement.
For subscribe/unsubscribe info, please email headlinesATbentonDOTorg

Kevin Taglang
Executive Editor, Communications-related Headlines
Benton Institute
for Broadband & Society
1041 Ridge Rd, Unit 214
Wilmette, IL 60091
847-220-4531
headlines AT benton DOT org
Share this edition:


Broadband Delivers Opportunities and Strengthens Communities