New Data, Old Divides

Friday, December 14, 2018
Weekly Digest
New Data, Old Divides
You’re reading the Benton Foundation’s Weekly Round-up, a recap of the biggest (or most overlooked) telecommunications stories of the week. The round-up is delivered via e-mail each Friday.
Round-Up for the Week of December 10-14, 2018

On December 6, the U.S. Census Bureau released the 2013-2017 American Community Survey (ACS) five-year estimate including data on internet subscription rates.
The new data provide powerful insight into the inequity of U.S. broadband adoption, especially among neighboring counties. But the research also re-emphasizes the necessity for more accurate broadband maps. Below we unpack what the new Census numbers tell us, and look ahead to the future of broadband adoption measurements.
New Data, Old Divides
For the first time, U.S. Census Bureau statistics showed the impact a county’s geography and income level can have on internet subscription rates. While the Census Bureau has previously reported on national estimates of internet subscription, the new data for all counties in the U.S. allows us to look at trends across smaller areas, including less-populated rural areas.
“The ACS has been collecting large-scale survey information on household computer ownership and Internet access for the past five years, but until now that data has only been published for communities with populations of more than 20,000, and only at the community-wide level. Now, for the first time, the Census is making this same data available for every Census tract in the country. This is an incredible new resource for people in city neighborhoods, small communities, rural and tribal areas to understand and address the broadband divides in our own diverse communities.” - NDIA Executive Director Angela Siefer
The Census Bureau defined broadband internet subscriptions as “any service that is capable of delivering faster speeds than ‘dial up.’” If respondents said they had access (in this case, meaning they subscribe or are able to obtain access for free), they could also indicate that they had: a.) cellular data plan for a smartphone or other mobile device, b.) broadband (high-speed) internet service such as cable, fiber optic, or DSL, c.) satellite internet service, d.) dial-up or e.) some other service.
The new data show old divides: broadband adoption differences between rural/urban and high-/low-income areas. Some key findings:
The Rural/Urban Divide
- Nationally, 78 percent of households subscribe to the internet, but households in both rural and lower-income counties trail the national average by 13 points.
- In the average “mostly urban” county, over 75 percent of households have a subscription to broadband internet. The average county classified as “mostly rural” has a household subscription rate of approximately 67 percent, while the average “completely rural” county has a subscription rate of 65 percent.
- “Mostly rural” counties tend to have lower subscription rates, with many such counties located across the South. The Northeast, Midwest, and parts of the West contain a number of “mostly rural” counties with subscription rates above the national average. “Completely rural” counties also tend to have broadband subscription rates below the national average, and many of these are found in the South.
- Lack of internet in rural areas was also notable for Native Americans, who had a 67 percent broadband internet subscription rate, compared with an 82 percent rate for non-Native American individuals. Native Americans living on American Indian land had a rate of 53 percent.
The High/Low-Income Divide
- An average of over 77 percent of households has a broadband subscription in counties with median household incomes equal to or above $50,000 per year. In counties with median incomes below $50,000 per year, the average rate of subscription falls to roughly 65 percent.
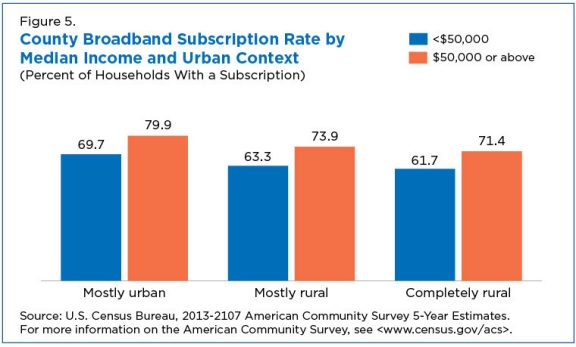
- “Completely rural,” lower-income counties fare the worst, with an average broadband subscription rate of only 61.7 percent.
- Despite differences in level of income and rurality, households in “mostly urban,” lower-income counties are within 2 percentage points of “completely rural,” higher-income counties in their rate of subscription. An average of 69.7 percent of households subscribes to broadband internet in “mostly urban,” lower-income counties compared to 71.4 percent in “completely rural,” higher-income counties.
Mapping the Findings
The National Digital Inclusion Alliance (NDIA) created and published a series of interactive maps using the Census Bureau data to visualize the broadband adoption divides. The maps show: 1) the percentages of households with wireline broadband connections (broadband through cable fiber optic, or DSL), and 2) the percentage of households with no home Internet connection of any kind, not even mobile, for every census tract in the U.S. I highly recommend heading over to NDIA's website to see the broadband adoption divides in your community for yourself.
New Broadband Maps?
Accurate measurements on the reach of broadband deployment are important for many reasons, most importantly because these statistics guide policymaking and federal funding for underserved areas.
The Federal Communications Commission’s broadband deployment data, which relies on reporting from facilities-based broadband providers, has been a hot-button policy issue for a while. [See, for example, Everybody complains about the Rural Broadband Divide, but nobody does anything about it] This year, FCC oversight hearings in both the Senate and the House revealed bipartisan support among lawmakers for more accurate broadband maps.
Wired Broadband Map
Earlier this year, the FCC unveiled the Fixed Broadband Deployment map. On Dec. 7, 2018, the FCC announced the old National Broadband Map will be decommissioned on Dec. 21, 2018, and that the Fixed Broadband Deployment map will be the premiere map.
When the Fixed Broadband Deployment map was unveiled, it was an exciting day in tech policy land. But the excitement was short-lived. Why?
The map, obviously, does not include mobile broadband’s reach. And, the map is inaccurate. An entire Census block is deemed as “served” with broadband if just one home in that entire block has service. This leads to overstatements in the level of broadband availability, especially in rural areas where Census blocks are large. Indeed, a September report from the Government Accountability Office concluded, "FCC data overstated tribes' broadband availability and access to broadband service. These overstatements limit FCC and tribal users' ability to target broadband funding to tribal lands."
Furthermore, there is no independent validation or verification process for the data provided by internet service providers (ISPs).
“In policy conversations, ISP lobbyists lean heavily on the FCC’s flawed data to falsely suggest that American broadband is dirt cheap and ultra-competitive, despite real-world evidence to the contrary. ISPs also use this false reality to imply meaningful consumer protections aren’t necessary because the market is healthy (as we saw during the fight over net neutrality),” wrote Karl Bode.
Policymakers with a deregulatory bent can use this inaccurate data to advance their agendas, too. “By painting a far rosier picture of the digital divide than is warranted, policymakers have a far less sense of urgency about fixing the problem,” noted Gigi Sohn, Benton senior fellow and counselor to former FCC Chairman Tom Wheeler. “And of course, if you don’t know the breadth of a problem, policymakers can’t be very strategic or targeted in fixing it.”
In the Consolidated Appropriations Act, Congress set aside $7.5 million in funds for the Department of Commerce’s National Telecommunications and Information Administration (NTIA) to work on the National Broadband Map. NTIA is currently considering sources of broadband availability data, mechanisms to validate broadband availability data using multiple data sources or new techniques, and approaches to leverage such data and techniques to inform broadband planning at the state and national levels by promoting the most efficient use of state or federal funding to areas that are insufficiently served by broadband. But the $7.5 million pales to the $350 million allocated to NTIA in 2009 to create and maintain the first national broadband inventory map.
Wireless Broadband Map
Accurate wireless broadband deployment maps are important to inform the FCC’s Universal Service Fund support of wireless infrastructure expansion in rural areas. The FCC’s Mobility Fund Phase II is poised to distribute over $4.5 billion over the next decade to help with wireless deployment. Because the National Broadband Map wasn’t accurate enough, the FCC created a special process to create a new map to determine which areas are eligible to receive Mobility Fund support.
In August, the FCC kicked off a challenge process to allow interested parties to balance data provided by ISPs for the wireless map with on-the-ground experience. But, the challenge process was a complicated task for those wishing to contribute. The challenge window is now closed and the FCC is working on examining all of the submissions from carriers for accuracy and consistency.
On December 7, the FCC announced it was investigating potential Mobility Fund mapping rule violations. The FCC did not name the “major wireless carrier” it is investigating, but it could be Verizon, T-Mobile, or both. The Rural Wireless Association (RWA) filed a complaint in August claiming that Verizon “grossly overstated” its 4G LTE coverage in government filings. And RWA filed a complaint on December 10, writing, “T-Mobile projected its future 4G LTE coverage and reported that coverage to the Commission ahead of or by the January 4, 2018 deadline instead of the coverage it had in place by the January 4, 2018 deadline.”
Commissioner Rosenworcel’s “Three C’s of Broadband Cartography”
On December 11, FCC Commissioner Jessica Rosenworcel delivered a speech on improving broadband maps. She presented the three C’s of broadband cartography:
- The first c is coordination. “Policymakers need to work collaboratively across all levels of government to get our maps right.”
- The next c is for correct. “We need to put a premium on accuracy. “
- The next c is for creative. “We need to explore new ideas about how we can improve our maps.” She posed such ideas as giving the Universal Service Administrative Company a role in validating the data before the FCC makes the funds available to carriers, using FCC offices around the country to spot check the data in existing FCC maps, starting a pilot project with postal trucks and having them collect wireless deployment data as they go about their routes in rural communities, and fully embracing crowdsourcing.
“The best map will be coordinated, correct, and creative. It will be a Citizens Broadband Map. And the time to start building it is right now,” she concluded.
Getting to True Numbers
It is frustrating, to say the least, that we do not have accurate numbers on the country’s Digital Divide. The frustration is compounded because of frequent interchange by policymakers of the term “broadband access” (meaning the broadband network passes a location) vs. “broadband adoption” (meaning you use the internet, typically as a subscriber). Moreover, there has been evolving definitions of what speed and technology constitutes “broadband.”
As a result, the policy discussion around the Digital Divide can be confusing. For example, the FCC’s 2018 Broadband Deployment Report claimed that at the end of 2016, “92.3 percent of all Americans have access to fixed terrestrial broadband at speeds of 25 Mbps/3 Mbps.” Nonetheless, over 24 million Americans still lacked access to 25 Mbps/3Mbps broadband.
But December 4, a new study by Microsoft researchers on the actual use of high-speed internet across the country concluded that 162.8 million people do not use the internet at broadband speeds.
In her “Three C’s” speech, Commissioner Rosenworcel referenced these discrepancies: “There’s a big delta between 24 million and 162 million. It needs explanation.” She didn't offer one, but, of course, the FCC is measuring access and Microsoft is measuring adoption.
Who can help fix this confusion? Congress would be a good place to start. Congress could set the parameters for measurement and provide the FCC or other agencies with the resources necessary to obtain accurate data. With the 2020 census around the corner, the time may be right to get even more granular and accurate broadband data. To repeat Sohn: "If you don’t know the breadth of a problem, policymakers can’t be very strategic or targeted in fixing it.”
Conclusion
The new ACS data results from a large, independent study of broadband adoption and gives us new perspectives on the Digital Divide. But we still need more accurate data. Irrefutably, there remain deep inequities in broadband access and adoption. At Benton, our goal is to bring open, affordable, high-capacity broadband to all people in the U.S. to ensure a thriving democracy. Accurate broadband maps are one necessary step towards realizing this vision.
This will be the last Weekly of 2018. We will return on January 11, 2019. It's been a heck of a year. Take your own stroll down Memory Lane by looking back at all of the Weeklys from 2018.
Quick Bits
- Millions Of Comments About The FCC's Net Neutrality Rules Were Fake. Now The Feds Are Investigating. (BuzzFeed)
- Department of Agriculture Launches New Program to Create High-Speed Internet e-Connectivity in Rural America (USDA)
- FCC Adopts the First Consolidated Communications Marketplace Report (FCC)
- FCC Announces BDAC Re-Charter and Solicits Nominations for Membership (FCC)
- FCC Opens Office of Economics and Analytics (FCC)
Weekend Reads (resist tl;dr)
- Your Apps Know Where You Were Last Night, and They’re Not Keeping It Secret (New York Times)
- Google CEO Sundar Pichai Faces Privacy and Bias Questions in Congress (New York Times)
- William Barr, President Trump's new AG and Time Warner board member, had charged DOJ's Antitrust Chief with giving an 'inaccurate' account of meeting with Time Warner (Washington Post)
- Digital Divide Among School-Age Children Narrows, but Millions Still Lack Internet Connections (NTIA)
ICYMI from Benton
Benton, a non-profit, operating foundation, believes that communication policy - rooted in the values of access, equity, and diversity - has the power to deliver new opportunities and strengthen communities to bridge our divides. Our goal is to bring open, affordable, high-capacity broadband to all people in the U.S. to ensure a thriving democracy.
© Benton Foundation 2018. Redistribution of this email publication - both internally and externally - is encouraged if it includes this copyright statement.
For subscribe/unsubscribe info, please email headlinesATbentonDOTorg

Kevin Taglang
Executive Editor, Communications-related Headlines
Benton Foundation
727 Chicago Avenue
Evanston, IL 60202
847-328-3049
headlines AT benton DOT org
Share this edition:


PUBLIC INTEREST VOICES FOR THE DIGITAL AGE